Indicators are one of the most valuable tools for traders in traditional and crypto markets. This is because the stock markets are a highly dynamic and constantly changing space, which makes traders face price changes and behaviors every minute. But thanks to the indicators, traders have a tool that allows them to study these changes and thus facilitate the execution of tasks and decision-making.
Indicators, an introduction
UA simple definition of what an indicator is would be:
It is a statistical tool that is used to measure the current conditions of a market. These serve to show, analyze and forecast financial or economic trends, which serve to make decisions regarding the information they provide.
In this way, we see that indicators are only a means that helps us to know how a stock market behaves now or in the future. A very useful situation, if our work is based on making a profit from investments in these markets.

Introductory course to DeFi
Medium levelTime to update. Traditional finance has changed, discover the revolutionary ecosystem of decentralized finance (DeFi).
How are the indicators classified?
The indicators can be classified essentially into two groups, which are:
- Economical: These are statistics that are used to measure the growth or contraction of the economy as a whole or of the sectors within the economy. They are widely used in fundamental analysis, as they allow quantifying current economic and industrial conditions. They are used to provide information on the future profitability potential of public companies.
- Technicians: They are widely used in technical analysis to predict changes in stock trends or price patterns in any traded asset.
Warning: Excess Indicators (SCAM)
This is a very delicate situation that is usually seen a lot in trading. Traders usually use two to three indicators to forecast the market and make their investment decisions. But there are platforms and brokers, which go much further using a number of "astronomical" indicators. This situation often hides attempts to manipulate people who read the forecasts. In short, this can induce people to make investments at the wrong time, due to the information they handle and which can often be contradictory.
If in any case, you are doing trading, remember; that the excess of information can induce to make wrong decisions. Fair, necessary information and a clear mind are the cornerstone of good work decisions.
Get started on Bit2Me and jump into the world of cryptocurrencies with a head start. Sign up easily and get €5 FREE on your first purchase with this link. Don't wait any longer to join the crypto revolution! Register
Indicators with Lag
The lagged indicators are a series of indicators that show a measurable economic factor after a major economic change. These types of indicators are classified within the type of technical indicators, as they track the price action of an underlying asset. The lag flag name is derived from that They show the result of past actions within a certain period of time.
Despite this, these types of indicators they are very useful to study the signals within a market. This is because serve to confirm the strength of a given trend, prior to making a decision. This is possible because lagged indicators wait for significant moves in the market, before providing a signal.
However, although they are very useful to confirm trends, their way of acting presents two clear disadvantages. The first, cannot predict the market trend, they only confirm it. The second is, that the signal to enter positions by the trader always suffers from delay and it does not allow to take advantage of all the momentum of the trend.
Some examples of lagged indicators are as follows:
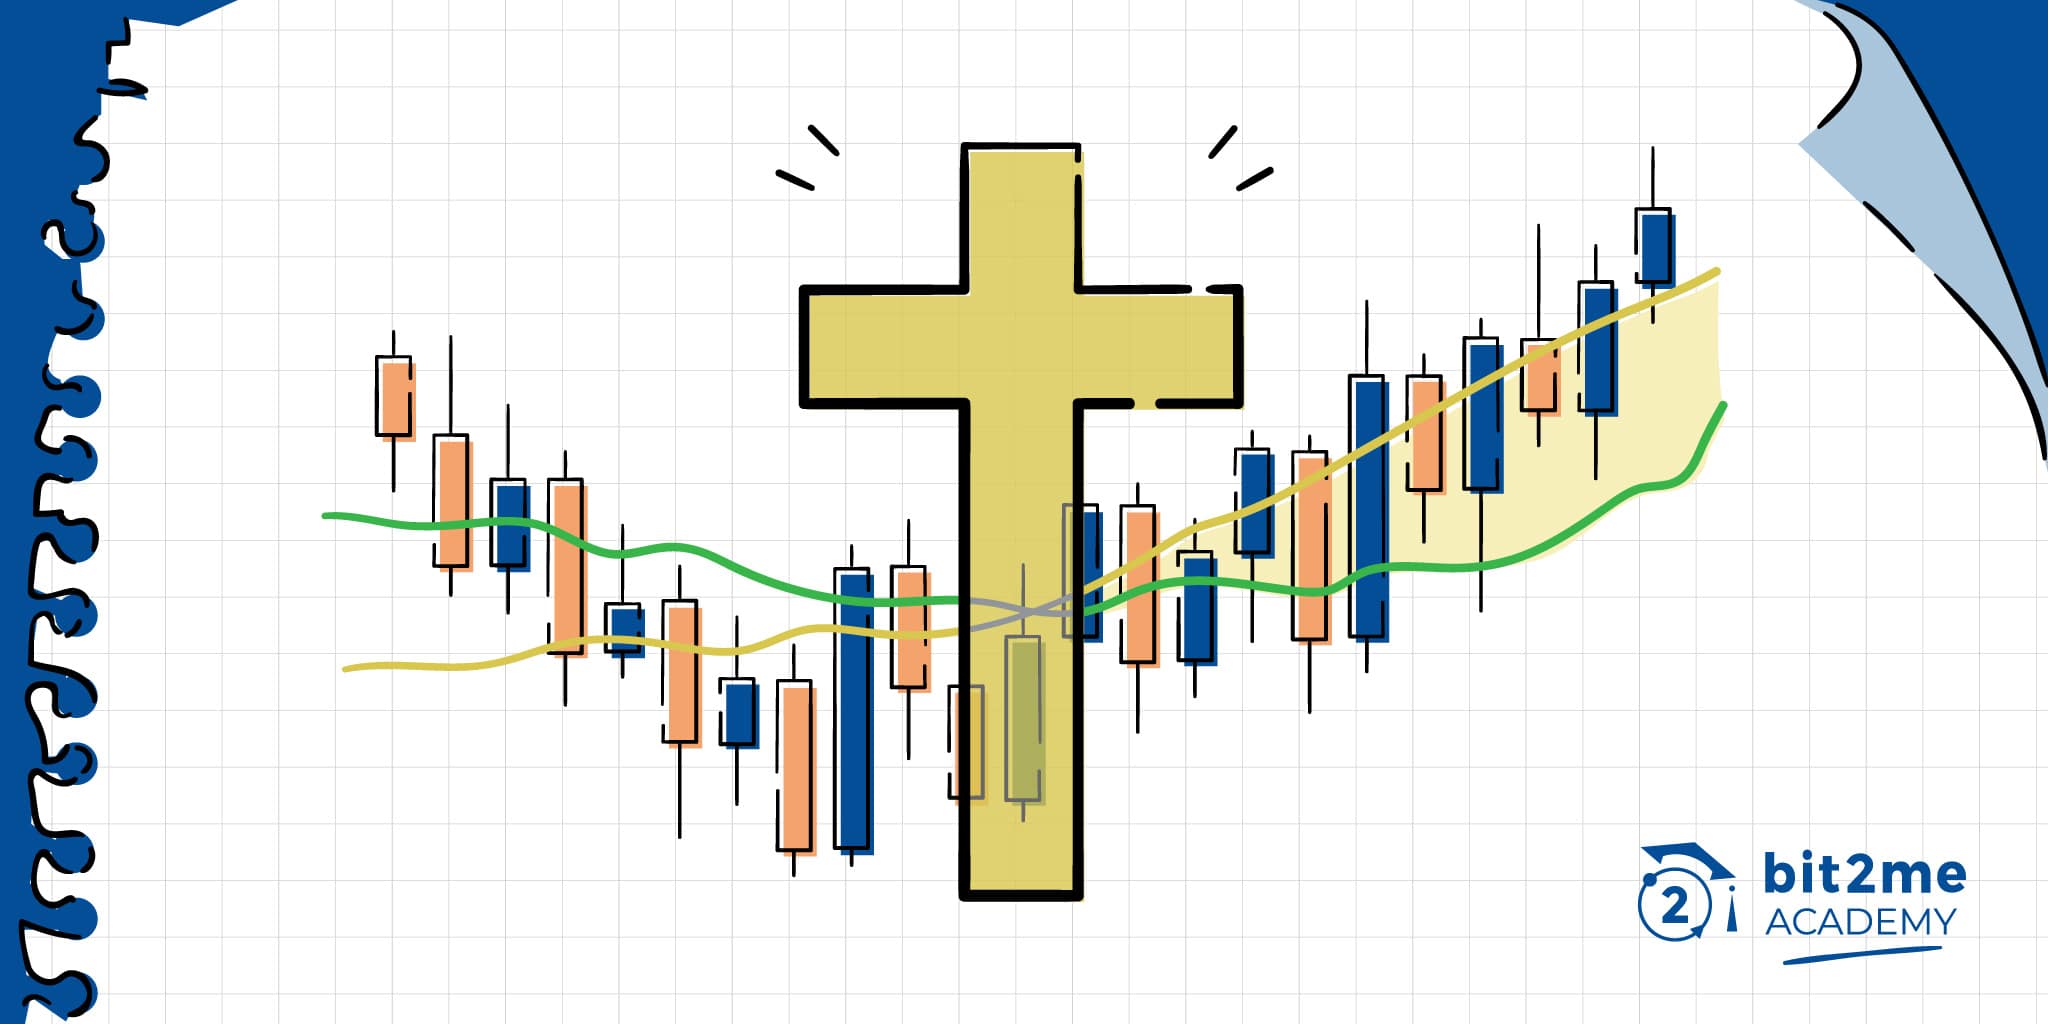
- Averages (simple, exponential or EMA). This is a type of indicator widely used to recognize the trend of a security in the market.
- MACD. This is another type of trend indicator that is used to interpret the trend and shows the relationship between two moving averages of the prices of a security in the market.
- Double EMA. This is a type of indicator that has a low lag seeking to provide information more quickly to the trader.
- Crossover. It is a type of indicator that does a data crossing so that the trader can observe particularities of the price and predict its movements.
Leading indicators
This is another type of indicators that traders usually use. The objective of leading indicators or leading indicators is to predict what the reaction of a market will be, reactions in which different known or unknown factors are combined.
To achieve this, these indicators take into account various variables inside and outside the market to make their prediction. Furthermore, these indicators are more complex to determine than the indicators with lag. They are predictive and therefore do not provide a guarantee of success. This not only makes it difficult to decide which leading indicators to use, but also tends to provoke heated debate about their validity.
Some of the most important leading indicators are:
- RSI. Its name is Relative Strength Index or Relative Strength Index, and is an indicator used to measure the strength of a trend.
- Momentum This is an indicator created to show the trend of the prices of an asset and the changes it has had in a certain time.
- Stochastic. This indicator was created in order to determine the overbought and oversold conditions of an asset within a market.
Oscillators
Oscillators are another type of widely used technical indicator. Oscillators are mathematical models applied to price with great anticipatory value, based on some specific observation on market behavior. In a market, these indicators are usually drawn below the stock chart y measure the strength of price trends or movements.
There is a huge number of oscillators, so even each one can build their own oscillator, to measure the aspect of the market that interests them most.
Among the best known oscillators can be named:
- PCS: it is configured as a determining indicator in the technical analysis, and in this particular case it tries to guess the trend of the values, based on the measure of the divergence between the closing price of the market closing and the high and low prices of the same in a series of periods.
Volatility Indicators
One of the most important things for a trader is to stay calm and not get carried away by runaway emotions. All this in order not to partially or completely lose the investments made. To assist traders in this task, volatility indicators have been created.
Volatility indicators are tools to analyze changes in market prices during a specific period of time. The faster prices change, the greater the volatility and, conversely, the slower, the lower the volatility. This can be measured and calculated on the basis of historical prices, as well as to identify trends. It also usually indicates whether a market is overbought or oversold., a situation that causes a price to be unreasonably high or low.
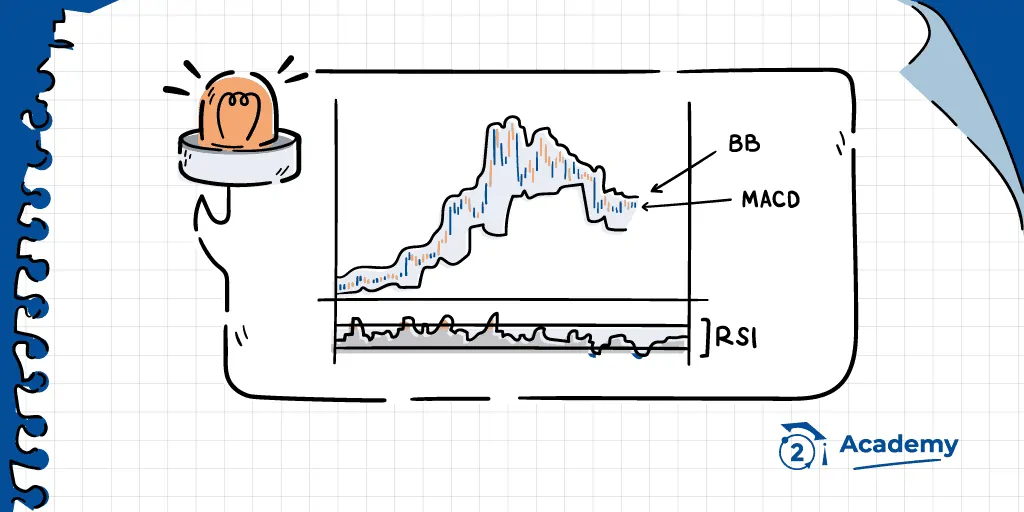
The possibilities of this tool help traders to identify the points where the price stops and potentially invests. They are typically used in combination with other signal generation conditions to supplement the information they offer. There are several volatility-based indicators that use such volatility in a smart way to help identify trading opportunities. Some examples of such indicators are the True Range Average (ATR), the very popular and easy to use Bollinger Bands (BB), Donchian channels and Keltner channels (KC).
Bit2Me Trade, an exchange with a whole suite of indicators at your fingertips
In our service Bit2MeTrade, you will have at hand a wide range of technical analysis indicators at your disposal. From the popular MACD, Bollinger, RSI and EMA, to the most specialized. All these indicators are at your disposal to facilitate the best decision-making during your trading session. And it is that with more than 80 different indicators, a real-time graph and a clear and simple interface, Bit2MeTrade it is your best trading option.