The concepts of support and resistance help us to find upper and lower limits through which a trend transits, being key to knowing how to buy and sell in cryptocurrency markets.
DThe basic concepts to follow the impulses of a market are those of support y resistance. Both are part of the call technical market analysis and as traders we must know them and delve into their capabilities and characteristics. Well, in this way, we will better understand the behavior of the markets and we will know how to adapt our decisions accordingly.
Now let's take a closer look at both concepts to understand them further.
Get started on Bit2Me and jump into the world of cryptocurrencies with a head start. Sign up easily and get €5 FREE on your first purchase with this link. Don't wait any longer to join the crypto revolution! Register
What is a support within a market?
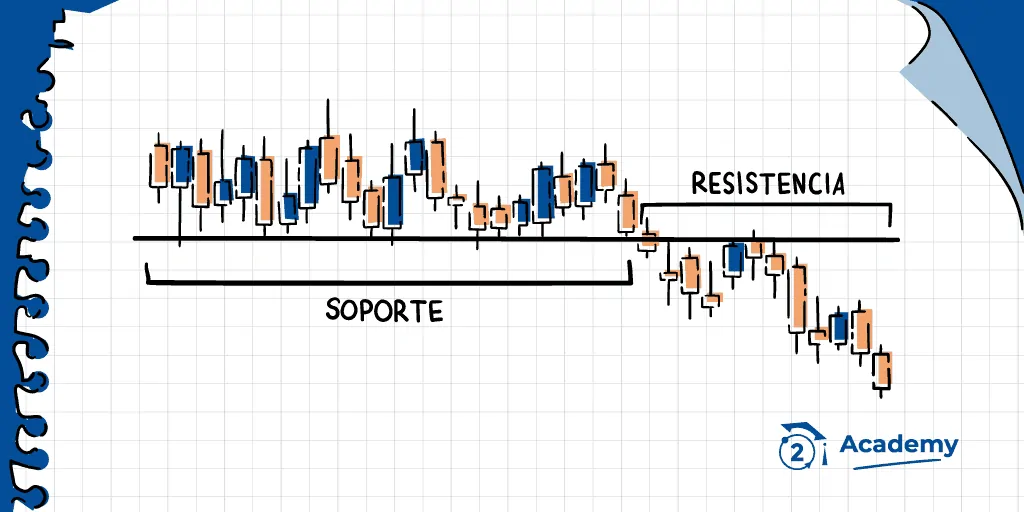
We are in front of a supportWhen the price of an asset slows its decline to start rising. This is because the buying force exceeds the selling force. That is to say, more assets are bought than are sold. Under this scenario, the downtrend or bearish will be slowed and the asset price will begin to rise initiating a uptrend or bullish.
To better understand this behavior, consider the following:
In a market or bag, the fact that an asset has a low price is attractive to make investments. This is especially true if the asset in question has a strong presence at all levels. Thus, investors take advantage of these low price moments to buy assets. Such action has an impact on the rise in its price. This is a simple example of the law of demand and supply.

What is a resistance within a market?
In this case, a resistance refers to the reverse case of support. That is to say, a resistance is when the asset price is very high and the selling force is greater than the buying force. This situation leads to the end of the upward trend in the price of the asset and the price begins to decline, initiating a downward trend.
Understanding what happens at this point is simple. Just imagine that investors are not interested in buying assets with a very high price. This decreases the demand for assets to a point that is less than the supply of them. In fact, at this moment the sale (or supply) of assets is skyrocketing. All this leads to the end of the uptrend and initiates a downtrend or bearish.

Supports, resistances and tendencies: What is their relationship?
Surely you have realized when reading the previous concepts that there is a connection between the concepts of support and resistance with that of trends. The truth is that yes, that relationship exists and it is easy to observe it if we have a price chart available.
In the first place, we can observe that tendencies they form what we call valleys y crests. This generates two new and interesting concepts that we will explain below:
Un valley, refers a space on the chart where prices begin to decline until reaching their minimum or support point. For its part, a cresta is formed when prices begin to rise until reaching their maximum or resistance point. Having clarified this, we can then connect the dots and understand the relationship between support, resistance and trends.
Una Uptrend is formed at the moment in which we have a series of successively higher ridges and valleys. This means that an uptrend is made up of higher and higher support and resistance points. On the contrary, a downtrend is formed at the moment in which we have a series of successively lower ridges and valleys. This means that a downtrend is made up of lower and lower support and resistance points.
In this simple way we have been able to relate the concepts of support, resistance and trends. Now, we have to know how important these concepts are and how useful they can be in market analysis.
Importance of support and resistance concepts
Trading the markets may seem simple but it is not. The changes that the assets within them experience second by second make it difficult for beginner traders to have a rather complex first moment. But nevertheless, Support and resistance concepts can be of great help when trading. Hence the importance of knowing and assimilating them to know how to put them into practice.
Support and resistance levels are usually very well marked and clearly visible on a price chart.. In fact, it is common to see how the price of an asset "Bounce" between a minimum and maximum price range. This gives us a clear and very fast idea of what is the support and resistance of the value of an asset in question. Despite this, as traders we must bear in mind that these values can be exceeded at any time. Here there are no certainties or absolutes, but there are tools that help us operate with a certain margin of safety.
Trading within these levels in well-defined time frames can help traders to profit with relatively low risk. In that way advancing in new trading strategies will mean learning to handle this and other tools that help us better predict the price behavior of an asset.
Usefulness of these concepts
For a trader the concepts of support and resistance are very useful. Among these we can highlight:
- It allows us to determine the entry and exit points of our operations. In this way, we can better predict when to enter and exit a trade in order to maximize our profits.
- They are useful for identify the points where to place our stop loss.
- They help us to recognize the meaning that the price will take. With this, we can anticipate what decision to make about our operations.
- They also help us Recognize channel breakouts and be prepared for any price burst.
Fibonnacci, a common way to use support and resistance

Leonardo of Pisa, also known as Fibonacci, was a renowned Italian mathematician of the XII century, recognized for his valuable work under the name of Fibonacci sequences. These sequences of numbers have a close relationship with the trading and they are called Fibonacci studies.
Fibonacci studies encompass a series of analysis tools based on the Fibonacci sequence and ratios. These represent geometric laws of nature and human behavior applied to financial markets.
Among the most popular tools in trading related to these numbers, we can mention: Fibonacci retracements, Fibonacci extensions, fibonacci bows, fibonacci fan and Fibonacci time zones. Other less popular tools are fibonacci ellipse, fibonacci spiral and Fibonacci channels.
Of course, all these tools give us data that we can use in trading. This thanks to the fact that they help us calculate objectives for an effective trading.
Example of plotting points using Fibonacci
For example, we can use this tool in a downtrend market. In this case, the Fibonacci levels are plotted from top to bottom, taking care to start, always from left to right. In this way, we obtain a series of points that are classified as follows:
- A point A that determines the maximum;
- Point B that indicates the minimum reached;
- Finally a point C, which indicates where the pullback has potentially ended, and a new trend move (entry point) can begin.
In the event that we are trading in an uptrend market, the Fibonacci level tracing is done from the bottom up. As in the previous one, the tracing is done from left to right. Thus we obtain the following points:
- A point A that indicates the minimum where the trend begins;
- Point B that tells us which is the maximum reached;
- Finally a point C, which indicates where the retracement has potentially ended, and a new trend movement (entry point) can begin.


 Author


